Free Access
Fig. 5
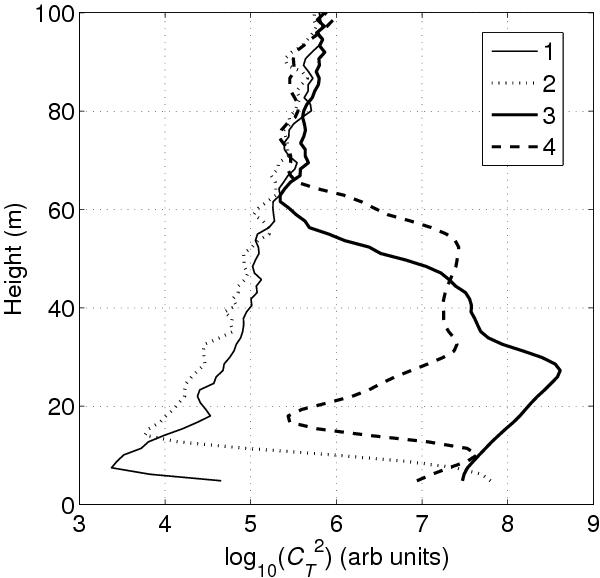
Typical vertical profiles of  corresponding to the sodar echograms in Fig. 6. 1 − 1500 LST 28/04/2012; 2 − 0200 LST 26/05/2012; 3 − 0500 LST 09/04/2012; 4 − 2100 LST 20/08/2012.
Current usage metrics show cumulative count of Article Views (full-text article views including HTML views, PDF and ePub downloads, according to the available data) and Abstracts Views on Vision4Press platform.
Data correspond to usage on the plateform after 2015. The current usage metrics is available 48-96 hours after online publication and is updated daily on week days.
Initial download of the metrics may take a while.