Fig. 4
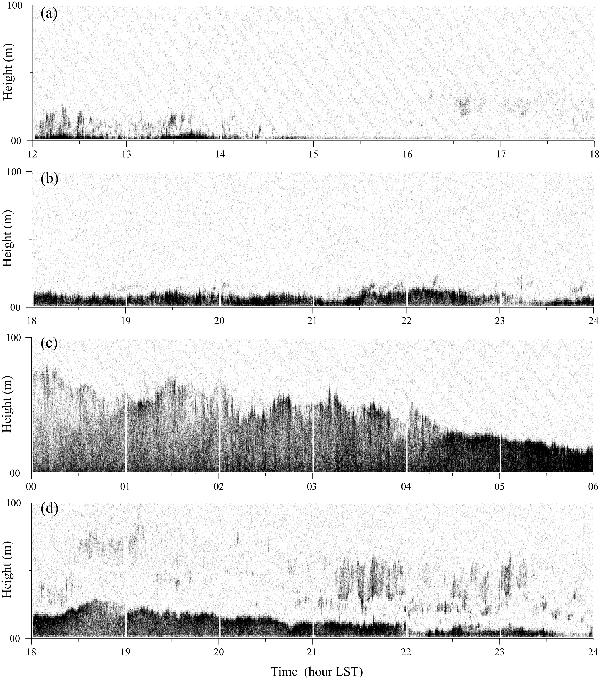
Some typical cross-section patterns of the surface-based turbulent layer depicted by sodar echograms. The grey-scale intensity is proportional to the strength of the thermal optically active turbulence characterised by the structure refraction index parameter  : a) very weak turbulence, 28/04/2012; b) weak turbulence, 26/05/2012; c) strong turbulence within the surface layer, 09/04/2012; d) turbulence in the surface layer and in elevated layers, 20/08/2012.
Current usage metrics show cumulative count of Article Views (full-text article views including HTML views, PDF and ePub downloads, according to the available data) and Abstracts Views on Vision4Press platform.
Data correspond to usage on the plateform after 2015. The current usage metrics is available 48-96 hours after online publication and is updated daily on week days.
Initial download of the metrics may take a while.