Fig. 2
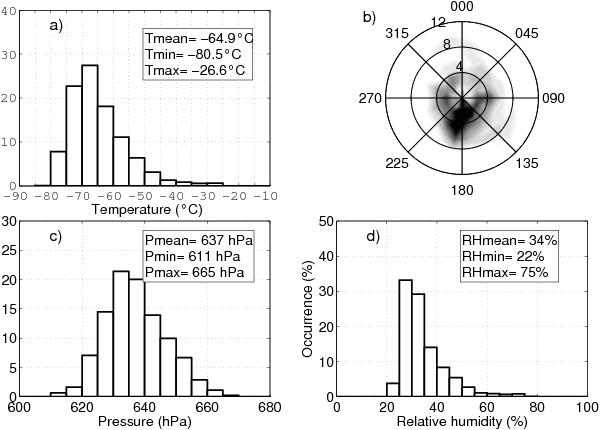
Statistical distribution of meteorological variables. a) Temperature; b) occurrence of wind speed and direction in polar coordinates; c) pressure; d) relative humidity for the period Apr.−Sep. 2012. The intensity of the grey-scale colour in panel b) is proportional to the occurrence of the given wind speed and direction. Wind speed and direction were measured at 3.6 m; temperature, pressure and humidity at 1.4 m.
Current usage metrics show cumulative count of Article Views (full-text article views including HTML views, PDF and ePub downloads, according to the available data) and Abstracts Views on Vision4Press platform.
Data correspond to usage on the plateform after 2015. The current usage metrics is available 48-96 hours after online publication and is updated daily on week days.
Initial download of the metrics may take a while.