Fig. 9
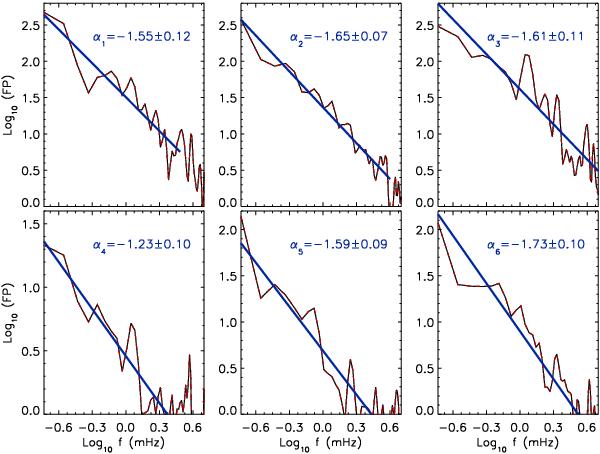
Fourier power distribution with frequency for locations 1–6 marked in Fig. 1. Thin continuous lines represent Fourier powers obtained from original signal (after subtracting mean values). Powers were fitted with power-law distribution with spectral indices (αn) as labelled and are over-plotted with the thick continuous lines.
Current usage metrics show cumulative count of Article Views (full-text article views including HTML views, PDF and ePub downloads, according to the available data) and Abstracts Views on Vision4Press platform.
Data correspond to usage on the plateform after 2015. The current usage metrics is available 48-96 hours after online publication and is updated daily on week days.
Initial download of the metrics may take a while.