Fig. 8
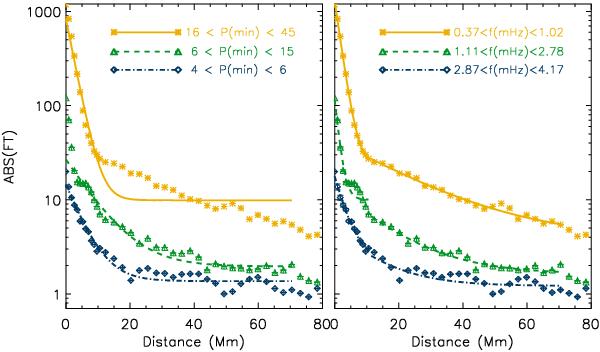
Variation of Fourier transform values with height in different period (frequency) ranges as marked with different colours. Dotted lines are observed decrease with height whereas continuous lines are fit applied to obtain dissipation lengths, as per Eq. (6), using full height range (left panel), and in two height ranges (0–10 Mm and 10–70 Mm, right panel). The obtained dissipation lengths in two different height ranges are summarised in Table 1.
Current usage metrics show cumulative count of Article Views (full-text article views including HTML views, PDF and ePub downloads, according to the available data) and Abstracts Views on Vision4Press platform.
Data correspond to usage on the plateform after 2015. The current usage metrics is available 48-96 hours after online publication and is updated daily on week days.
Initial download of the metrics may take a while.