Free Access
Fig. 6
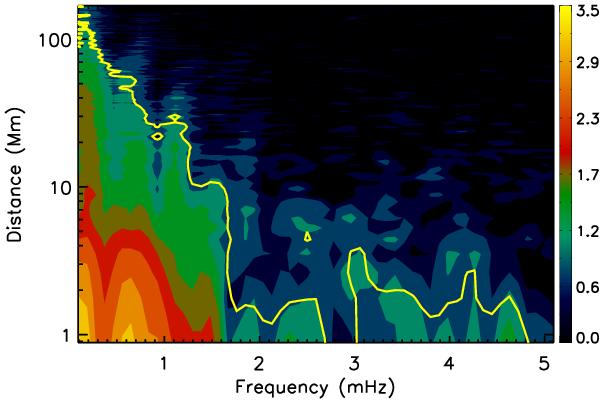
Frequency-distance Fourier power map (power in logarithmic scale) for plume region marked in Fig. 1 summed over 12″ width in X-direction. The over-plotted continuous yellow line contour indicates the same Fourier power level (≈0.99 in log scale) with frequency. Y-axis (distance axis) is in log scale.
Current usage metrics show cumulative count of Article Views (full-text article views including HTML views, PDF and ePub downloads, according to the available data) and Abstracts Views on Vision4Press platform.
Data correspond to usage on the plateform after 2015. The current usage metrics is available 48-96 hours after online publication and is updated daily on week days.
Initial download of the metrics may take a while.