Fig. 5
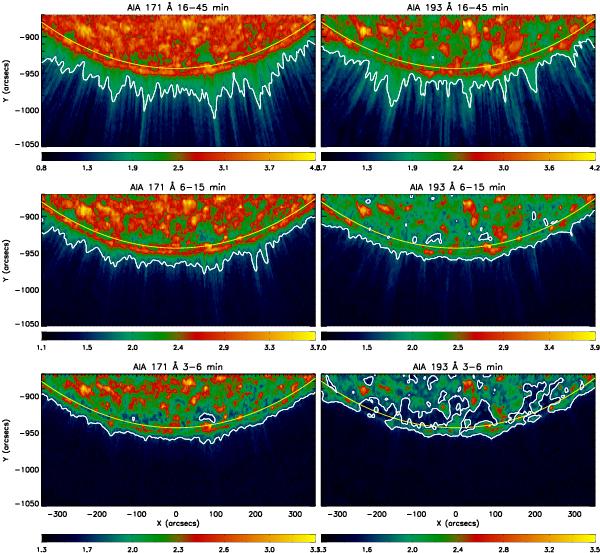
Fourier power map (power in logarithmic scale) of south polar coronal hole obtained from 171 Å (left panels) and 193 Å passbands (right panels) of AIA/SDO in different period ranges as labelled. White line contours are plotted at the same Fourier power level (≈1.7 in log scale) in all the panels of 171 Å and 193 Å passbands. Location of solar limb is also over-plotted with continuous yellow line in all the panels.
Current usage metrics show cumulative count of Article Views (full-text article views including HTML views, PDF and ePub downloads, according to the available data) and Abstracts Views on Vision4Press platform.
Data correspond to usage on the plateform after 2015. The current usage metrics is available 48-96 hours after online publication and is updated daily on week days.
Initial download of the metrics may take a while.