Fig. 4
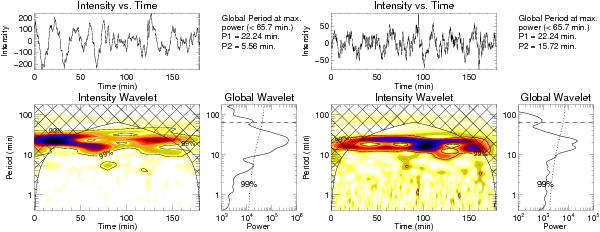
Wavelet results for the locations at a distance of 2.6 Mm (left panels) and 20.2 Mm (right panels) from the limb brightening height for a plume region marked in Fig. 1 in AIA 171 Å channels. In each set, the top panels show the trend subtracted (100-point running average) intensity variation with time. The bottom-left panels show the colour-inverted wavelet power spectrum with 99% confidence-level contours, while the bottom-right panels show the global wavelet power spectrum (wavelet power spectrum averaged over time) with 99% global confidence level drawn. The periods P1 and P2 at the locations of the first two maxima in the global wavelet spectrum are shown above the global wavelet spectrum.

Current usage metrics show cumulative count of Article Views (full-text article views including HTML views, PDF and ePub downloads, according to the available data) and Abstracts Views on Vision4Press platform.
Data correspond to usage on the plateform after 2015. The current usage metrics is available 48-96 hours after online publication and is updated daily on week days.
Initial download of the metrics may take a while.