Free Access
Fig. 2
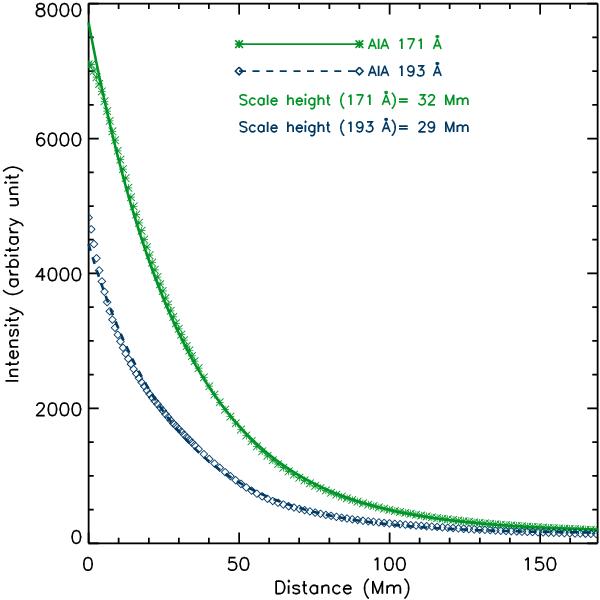
Average intensity decrease with height along the plume structure marked in Fig. 1. Intensity decrease are fitted with exponential function to obtain the intensity decay scale heights in AIA 171 Å and 193 Å passbands and are labelled in the figure.
Current usage metrics show cumulative count of Article Views (full-text article views including HTML views, PDF and ePub downloads, according to the available data) and Abstracts Views on Vision4Press platform.
Data correspond to usage on the plateform after 2015. The current usage metrics is available 48-96 hours after online publication and is updated daily on week days.
Initial download of the metrics may take a while.