Fig. 1
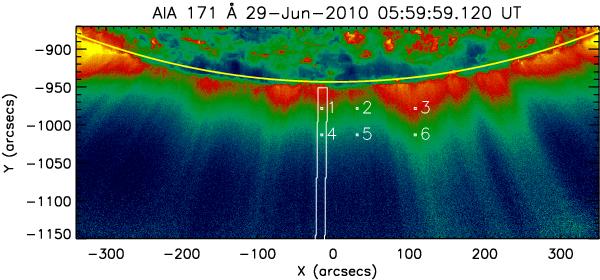
Context map of a south polar coronal hole from AIA/SDO 171 Å passband. The continuous white line box in off-limb region indicates the selected plume region for which a time–distance intensity map (see Fig. 3) and a frequency–distance Fourier power map (see Fig. 6) are obtained. Different small boxes indicate the individual spatial locations chosen for detailed analysis. To make the far off-limb structures visible, a radial enhancement filter is applied on the image.
Current usage metrics show cumulative count of Article Views (full-text article views including HTML views, PDF and ePub downloads, according to the available data) and Abstracts Views on Vision4Press platform.
Data correspond to usage on the plateform after 2015. The current usage metrics is available 48-96 hours after online publication and is updated daily on week days.
Initial download of the metrics may take a while.