Fig. 1
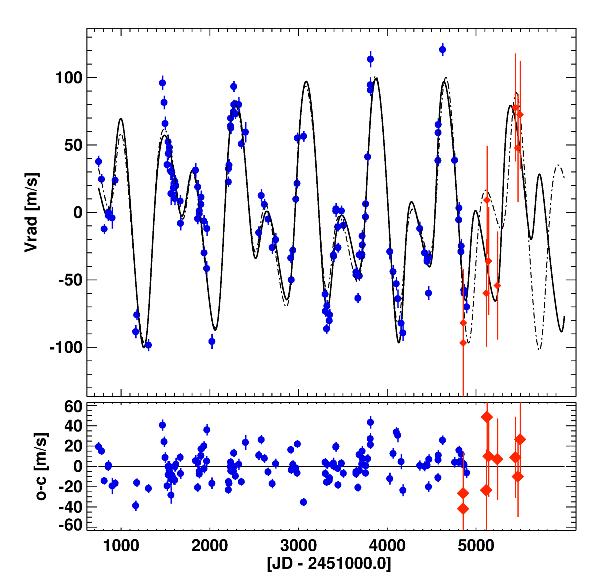
Top panel: radial velocities measured at Lick Observatory (blue circles), along with error bars, covering about 11 years from July 2000 to October 2011. Two best fits to the Lick data are overplotted: a double-Keplerian fit (dot-dashed) and the best dynamical edge-on coplanar fit (solid line). The two fits are not consistent in later epochs because of the gravitational interactions considered in the dynamical model. Despite the large estimated errors, the data from CRIRES (red diamonds) seem to follow the best fit prediction from the dynamical fit. Bottom panel: no systematics are visible in the residuals. The remaining radial velocity scatter has a standard deviation of 15.9 m s-1, most likely caused by rapid solar – like p – mode oscillations.
Current usage metrics show cumulative count of Article Views (full-text article views including HTML views, PDF and ePub downloads, according to the available data) and Abstracts Views on Vision4Press platform.
Data correspond to usage on the plateform after 2015. The current usage metrics is available 48-96 hours after online publication and is updated daily on week days.
Initial download of the metrics may take a while.