Fig. 7
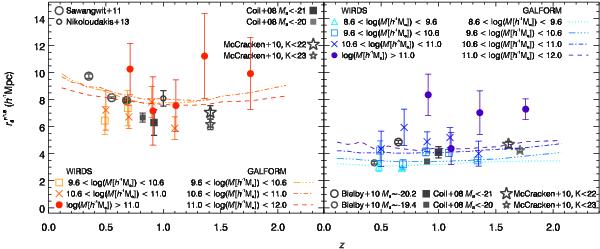
Clustering strength,  as a function of redshift for passive galaxies (left panel) and
star-forming galaxies (right panel). In each case, the populations
are split by mass, with triangles showing the 108.6 < M [h-1 M⊙] ≤
109.6 range, squares 109.6 < M [h-1 M⊙] ≤
1010.6, ×’s 1010.6 < M [h-1 M⊙] ≤
1011 and circles M [h-1 M⊙]
> 1011. The curves give the
predictions of the galform model for the different mass bins as indicated
in the legend.
as a function of redshift for passive galaxies (left panel) and
star-forming galaxies (right panel). In each case, the populations
are split by mass, with triangles showing the 108.6 < M [h-1 M⊙] ≤
109.6 range, squares 109.6 < M [h-1 M⊙] ≤
1010.6, ×’s 1010.6 < M [h-1 M⊙] ≤
1011 and circles M [h-1 M⊙]
> 1011. The curves give the
predictions of the galform model for the different mass bins as indicated
in the legend.
Current usage metrics show cumulative count of Article Views (full-text article views including HTML views, PDF and ePub downloads, according to the available data) and Abstracts Views on Vision4Press platform.
Data correspond to usage on the plateform after 2015. The current usage metrics is available 48-96 hours after online publication and is updated daily on week days.
Initial download of the metrics may take a while.