Fig. 3
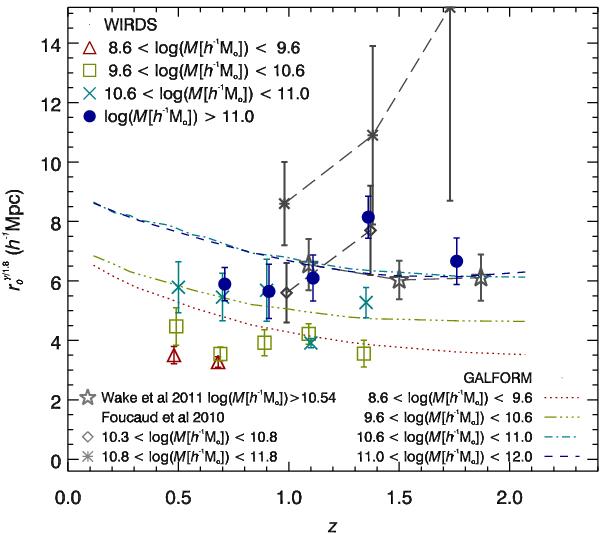
Clustering strength,  as a function of redshift for all galaxies with errors based on a bootstrap
estimate. The populations are split by mass, with triangles showing the
108.6 < M [h-1 M⊙] ≤
109.6 samples, squares 109.6 < M [h-1 M⊙] ≤
1010.6, ×’s 1010.6 < M [h-1 M⊙] ≤
1011 and circles M [h-1 M⊙]
> 1011. The curves give the
results of the galform model for the observed mass ranges, as indicated in
the legend. Results from Foucaud et al. (2010, grey
asterisks and crosses connected by dashed lines) and Wake et al. (2011, grey stars connected by dashed lines) are
also plotted.
as a function of redshift for all galaxies with errors based on a bootstrap
estimate. The populations are split by mass, with triangles showing the
108.6 < M [h-1 M⊙] ≤
109.6 samples, squares 109.6 < M [h-1 M⊙] ≤
1010.6, ×’s 1010.6 < M [h-1 M⊙] ≤
1011 and circles M [h-1 M⊙]
> 1011. The curves give the
results of the galform model for the observed mass ranges, as indicated in
the legend. Results from Foucaud et al. (2010, grey
asterisks and crosses connected by dashed lines) and Wake et al. (2011, grey stars connected by dashed lines) are
also plotted.
Current usage metrics show cumulative count of Article Views (full-text article views including HTML views, PDF and ePub downloads, according to the available data) and Abstracts Views on Vision4Press platform.
Data correspond to usage on the plateform after 2015. The current usage metrics is available 48-96 hours after online publication and is updated daily on week days.
Initial download of the metrics may take a while.