Fig. 2
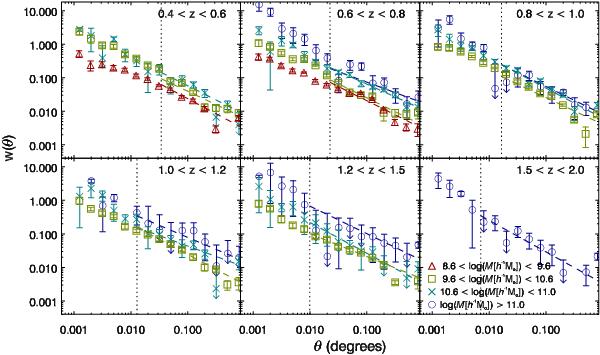
Auto-correlation, w(θ), of all galaxies up to z = 2 as a function of mass. The dotted vertical line in each figure gives the ≈1 h-1 Mpc scale for the given redshift range above which the fits are made to the data (i.e. in the 2-halo term regime). The triangles give the w(θ) measurement for the lowest mass range, 108.6 < M [h-1 M⊙] < 109.6 range, the squares the 109.6 < M [h-1 M⊙] < 1010.6 range, the ×’s the 1010.6 < M [h-1 M⊙] ≤ 1011 range and the circles the M [h-1 M⊙] > 1011.6 range. Errors were estimated using a bootstrap analysis and the dashed lines show the Aw-γ power law fits.
Current usage metrics show cumulative count of Article Views (full-text article views including HTML views, PDF and ePub downloads, according to the available data) and Abstracts Views on Vision4Press platform.
Data correspond to usage on the plateform after 2015. The current usage metrics is available 48-96 hours after online publication and is updated daily on week days.
Initial download of the metrics may take a while.