Fig. 10
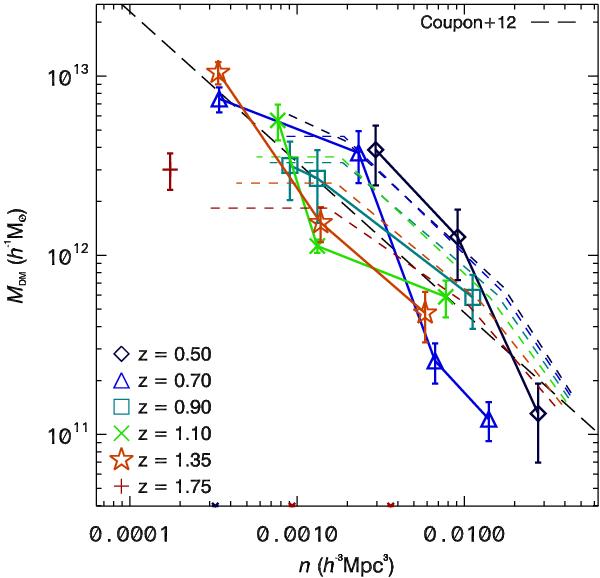
Mean halo mass versus galaxy number density for our range of galaxy stellar mass and redshift ranges. The points show our results with different point types giving different redshift ranges. The long-dashed line shows the best fit determined by Coupon et al. (2012) for z < 1 galaxies in the CFHTLS. The short-dashed curves show the galform predictions with the same colour coding as given in Fig. 9.
Current usage metrics show cumulative count of Article Views (full-text article views including HTML views, PDF and ePub downloads, according to the available data) and Abstracts Views on Vision4Press platform.
Data correspond to usage on the plateform after 2015. The current usage metrics is available 48-96 hours after online publication and is updated daily on week days.
Initial download of the metrics may take a while.