Fig. 9
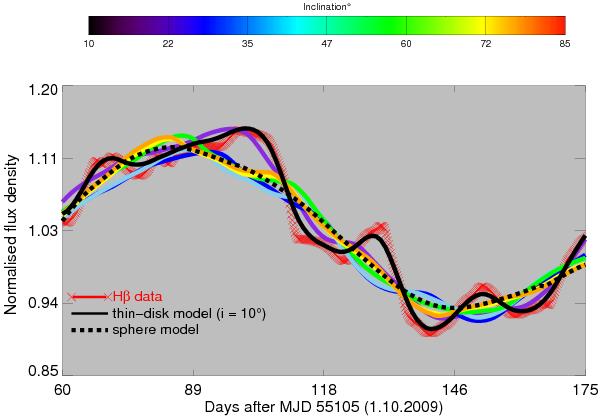
Hβ and best-fit model light curves of 3C 120. The interpolated Hβ light curve is shown with red crosses. Note the sharp drop of the light curve at days ~110 and ~130 as well as the sharp feature at days ~150 and the strong rise at day ~170. Both the spherical BLR model (black dotted line) and the inclined thin disks (i = 45° blue solid line, i = 60° green solid line) fail in fitting these sharp variation features. The features are best fitted by a thin-disk BLR model with inclination i = 10° (black solid line). Already at i = 20° (violet solid line) the thin disk fit yields a poorer chi-square. The light curves are shown only after the initial settling-down phase (~60 days), to account for the unknown continuum light curve before day zero.
Current usage metrics show cumulative count of Article Views (full-text article views including HTML views, PDF and ePub downloads, according to the available data) and Abstracts Views on Vision4Press platform.
Data correspond to usage on the plateform after 2015. The current usage metrics is available 48-96 hours after online publication and is updated daily on week days.
Initial download of the metrics may take a while.