Fig. 7
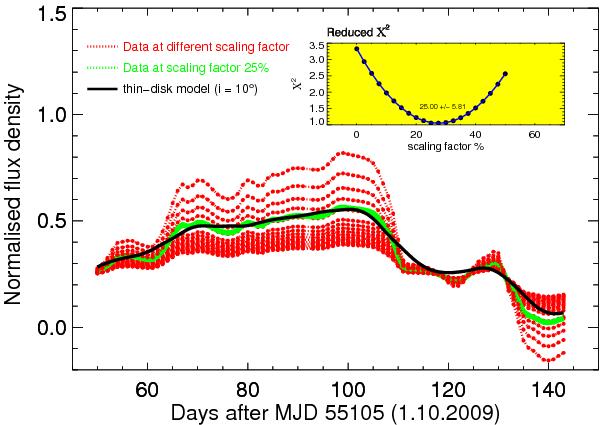
Hβ light curves of 3C 120 with different non-variable contributions C between 0% and 50% subtracted and re-normalised (red). The best model fit is shown in black and the best corresponding data in green. The inset shows the reduced chi-square as a function of C. The best chi-square is for C ~ 25%, perfectly consistent with the C-value from the long-term trend analysis in Fig. 6.
Current usage metrics show cumulative count of Article Views (full-text article views including HTML views, PDF and ePub downloads, according to the available data) and Abstracts Views on Vision4Press platform.
Data correspond to usage on the plateform after 2015. The current usage metrics is available 48-96 hours after online publication and is updated daily on week days.
Initial download of the metrics may take a while.