Fig. 2
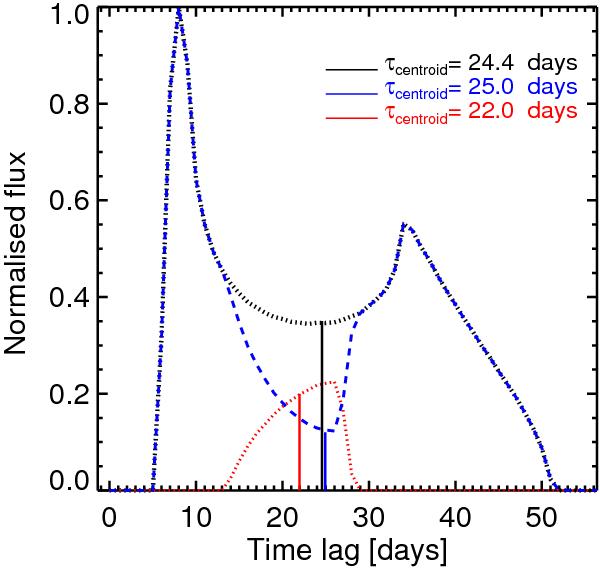
Response of the BLR to a single light-pulse. The BLR is modelled as a thin circular Keplerian-disk. The dotted curves show the time-delay function of the entire BLR (black), the BLR part outside of the NB (red dotted line), and the BLR part inside of the NB (blue dashed line). The response of the entire emission line (black) can be separated into a part contained by the NB and a part outside the NB. The solid vertical lines mark the centroids of the filter answers (i.e. the mean time lag). The difference between the blue and the black centroid is the response (echo) bias. The value of the measured echo (blue) is higher than that of the real one (black). Thus, cutting line wings will (marginally) increase the mean time lag.
Current usage metrics show cumulative count of Article Views (full-text article views including HTML views, PDF and ePub downloads, according to the available data) and Abstracts Views on Vision4Press platform.
Data correspond to usage on the plateform after 2015. The current usage metrics is available 48-96 hours after online publication and is updated daily on week days.
Initial download of the metrics may take a while.