Free Access
Fig. 11
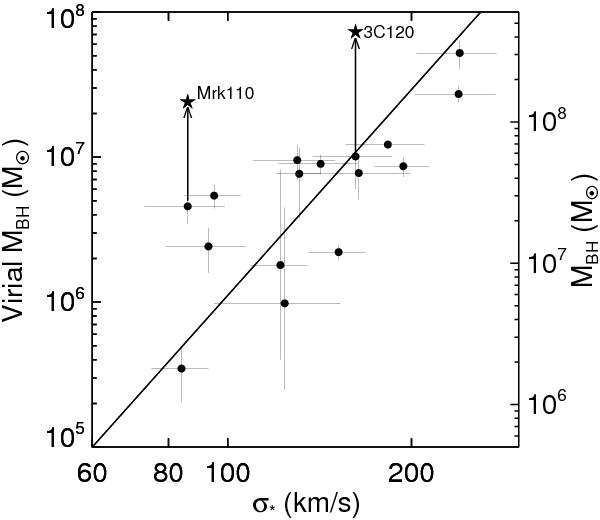
MBH–σ∗ relationship from Onken et al. (2004) using data of Peterson et al. (2004) (black dots). The black arrows show the positional shift of 3C 120 and Mrk110 with respect to the previous ones from Peterson et al. (2004). The solid line is the best-fit slope (case F02) from Onken et al. (2004).
Current usage metrics show cumulative count of Article Views (full-text article views including HTML views, PDF and ePub downloads, according to the available data) and Abstracts Views on Vision4Press platform.
Data correspond to usage on the plateform after 2015. The current usage metrics is available 48-96 hours after online publication and is updated daily on week days.
Initial download of the metrics may take a while.