Fig. 9
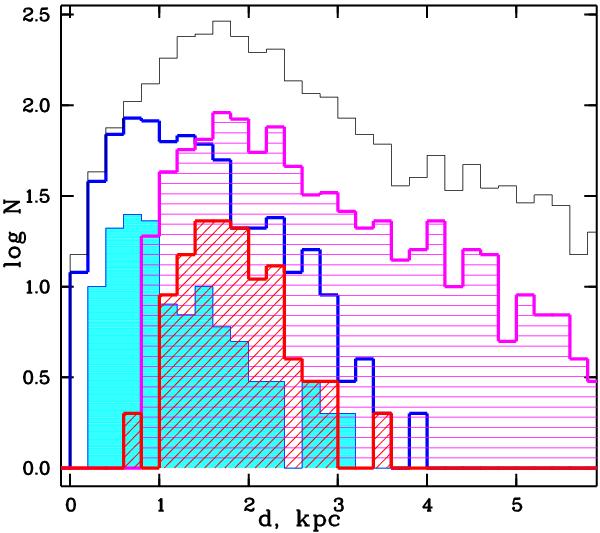
Comparison of distributions with distance of newly detected clusters for the optical COCD and NIR MWSC surveys. The distributions of new clusters are shown with red (current sample), magenta (candidates of Froebrich et al. 2007), and cyan (Kharchenko et al. 2005a, for COCD). The total distributions are shown with black (MWSC) and blue (COCD).
Current usage metrics show cumulative count of Article Views (full-text article views including HTML views, PDF and ePub downloads, according to the available data) and Abstracts Views on Vision4Press platform.
Data correspond to usage on the plateform after 2015. The current usage metrics is available 48-96 hours after online publication and is updated daily on week days.
Initial download of the metrics may take a while.