Fig. 7
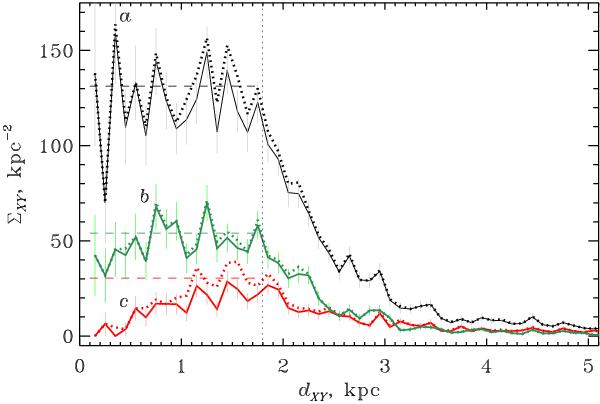
Contribution of the 139 new clusters to the surface density ΣXY versus the projected distance dXY. The distribution of all clusters is given in black (a), and the distributions of two age groups are indicated with green (log t = 8.3...9.0, b) and red (log t> 9.0, c). Solid curves correspond to the densities of known open clusters from the MWSC survey, the dotted curves include the new clusters, the dotted vertical line marks the completeness limit found for the total sample, and the dashed horizontal lines correspond to the average surface density for different age groups.
Current usage metrics show cumulative count of Article Views (full-text article views including HTML views, PDF and ePub downloads, according to the available data) and Abstracts Views on Vision4Press platform.
Data correspond to usage on the plateform after 2015. The current usage metrics is available 48-96 hours after online publication and is updated daily on week days.
Initial download of the metrics may take a while.