Free Access
Fig. 5
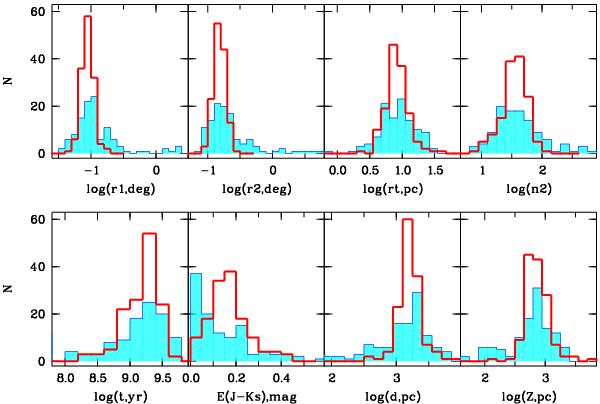
Distributions of the parameters of new clusters (open red histograms) and of MWSC open clusters at | b | > 20° (blue filled histograms). The upper row compares the distributions of “structural” parameters. The bottom row gives the distributions of “photometric” parameters. See text for an explanation of the definitions.
Current usage metrics show cumulative count of Article Views (full-text article views including HTML views, PDF and ePub downloads, according to the available data) and Abstracts Views on Vision4Press platform.
Data correspond to usage on the plateform after 2015. The current usage metrics is available 48-96 hours after online publication and is updated daily on week days.
Initial download of the metrics may take a while.