Free Access
Fig. 4
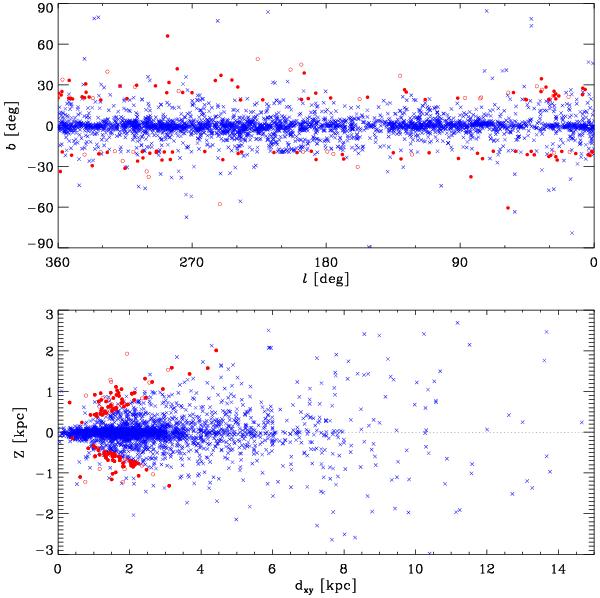
Distribution on the sky (upper panel) and in the plane (Z,dXY) (lower panel) of known MWSC open clusters (blue crosses) and newly detected clusters (red circles: filled for clusters detected using the filters, open for clusters detected without filters).
Current usage metrics show cumulative count of Article Views (full-text article views including HTML views, PDF and ePub downloads, according to the available data) and Abstracts Views on Vision4Press platform.
Data correspond to usage on the plateform after 2015. The current usage metrics is available 48-96 hours after online publication and is updated daily on week days.
Initial download of the metrics may take a while.