Fig. 7
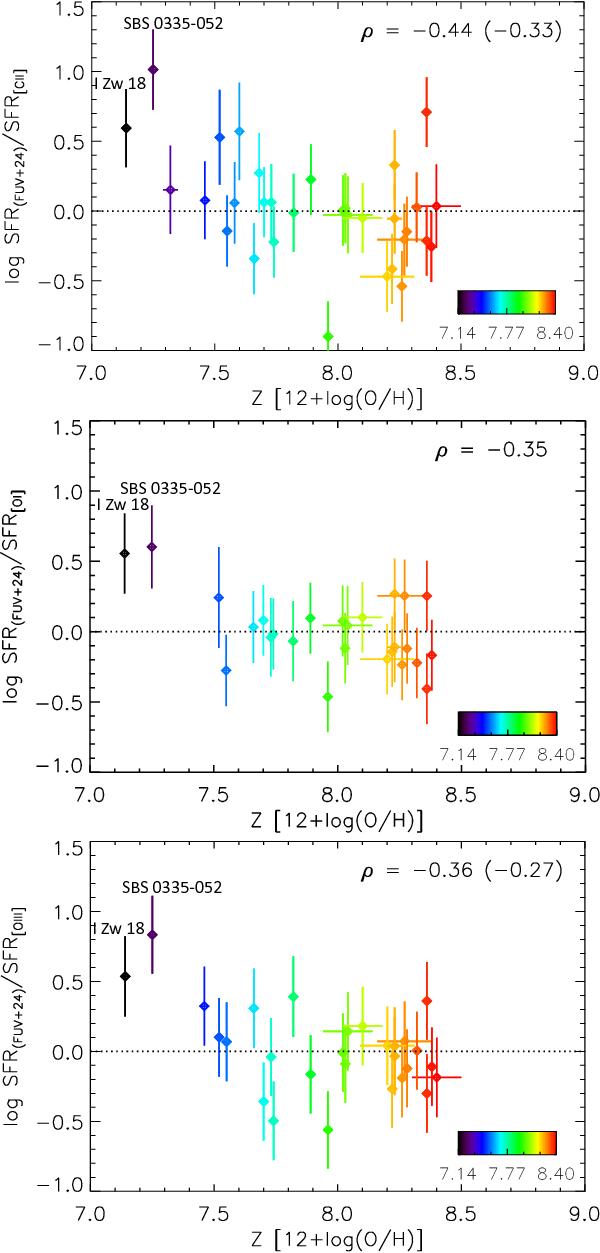
Relation between the dispersion from the SFR calibrations for [Cii] (top), [Oi]63 (middle), [Oiii]88 (bottom) as a function of oxygen abundance, 12 +log (O/H), on global galaxy scales. Galaxies are color-coded according to metallicity with increasing oxygen abundances ranging from black then blue, green and yellow to red colors. The Spearman’s rank correlation coefficients are indicated in the top right corner. In parentheses, we show the dispersion for the complete galaxy sample, i.e., global galaxies that have >5σ detections for all three lines [Cii], [Oi]63, and [Oiii]88.
Current usage metrics show cumulative count of Article Views (full-text article views including HTML views, PDF and ePub downloads, according to the available data) and Abstracts Views on Vision4Press platform.
Data correspond to usage on the plateform after 2015. The current usage metrics is available 48-96 hours after online publication and is updated daily on week days.
Initial download of the metrics may take a while.