Fig. 4
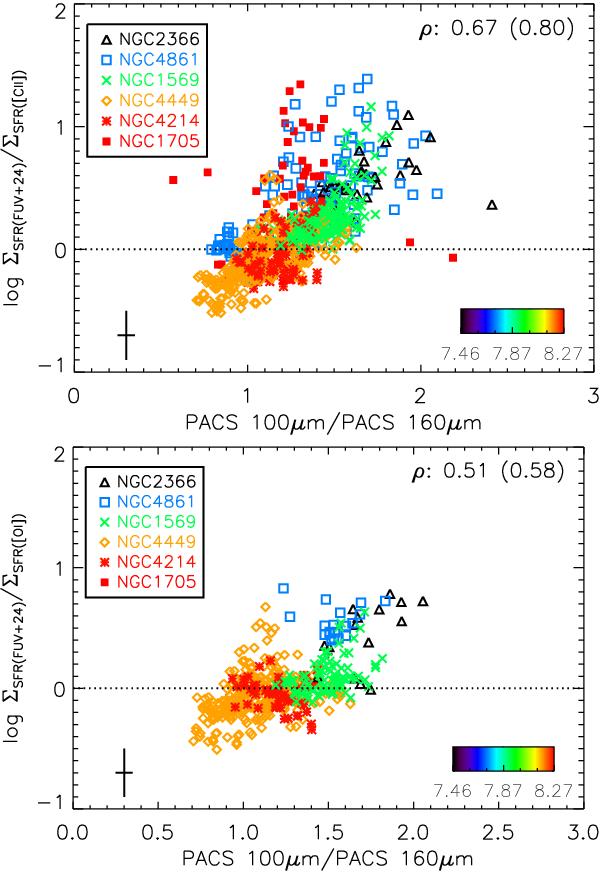
Spatially resolved galaxy relation between the dispersion from the SFR calibrations for [Cii] (top) and [Oi]63 (bottom) as a function of FIR color, i.e., PACS 100 μm/PACS 160 μm. The legend explains the symbols used for different galaxies with the color bar indicating the oxygen abundance. Representative error bars are indicated in the lower left corner. Uncertainties on the SFR include the errors on each of the SFR calibrators (GALEX FUV, MIPS 24 μm) as well as the average scatter in the reference calibration (see Table A.1). Uncertainties on the PACS line ratios incorporate the errors due to map-making as well as calibration uncertainties (5%). The Spearman’s rank correlation coefficients are presented in the top right corner. In parentheses, we show the dispersion for the complete galaxy sample, i.e., galaxy regions that have >5σ detections for all three lines [Cii], [Oi]63, and [Oiii]88.
Current usage metrics show cumulative count of Article Views (full-text article views including HTML views, PDF and ePub downloads, according to the available data) and Abstracts Views on Vision4Press platform.
Data correspond to usage on the plateform after 2015. The current usage metrics is available 48-96 hours after online publication and is updated daily on week days.
Initial download of the metrics may take a while.