Fig. A.2
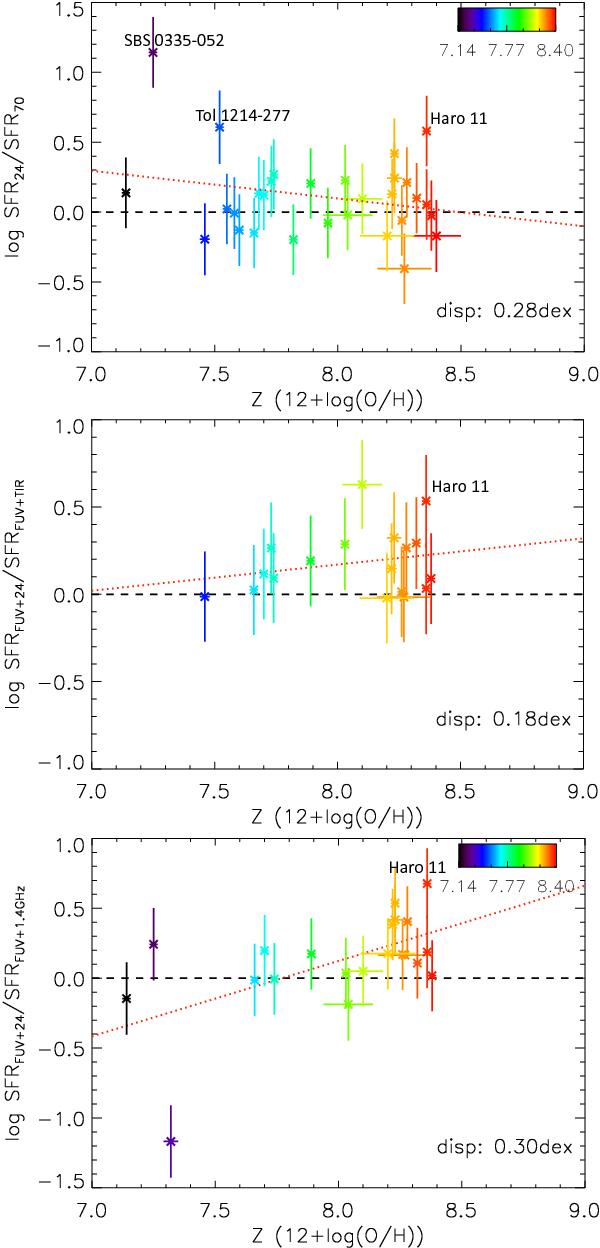
Comparison between the ratio of the SFR as obtained from the SFR calibrators MIPS 24 μm and PACS 70 μm (top), FUV+MIPS 24 μm and FUV+TIR (middle) and FUV+MIPS 24 μm and FUV+1.4 GHz (bottom) as a function of oxygen abundance. Galaxies are color-coded according to metallicity with increasing oxygen abundances ranging from black then blue, green and yellow to red colors. The dotted red and dashed black lines represent the best fit and a perfect one-to-one correlation, respectively. The dispersion around the best fit is indicated in the bottom right corner.
Current usage metrics show cumulative count of Article Views (full-text article views including HTML views, PDF and ePub downloads, according to the available data) and Abstracts Views on Vision4Press platform.
Data correspond to usage on the plateform after 2015. The current usage metrics is available 48-96 hours after online publication and is updated daily on week days.
Initial download of the metrics may take a while.