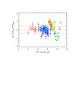
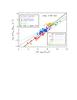
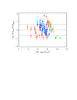
Fig. 10
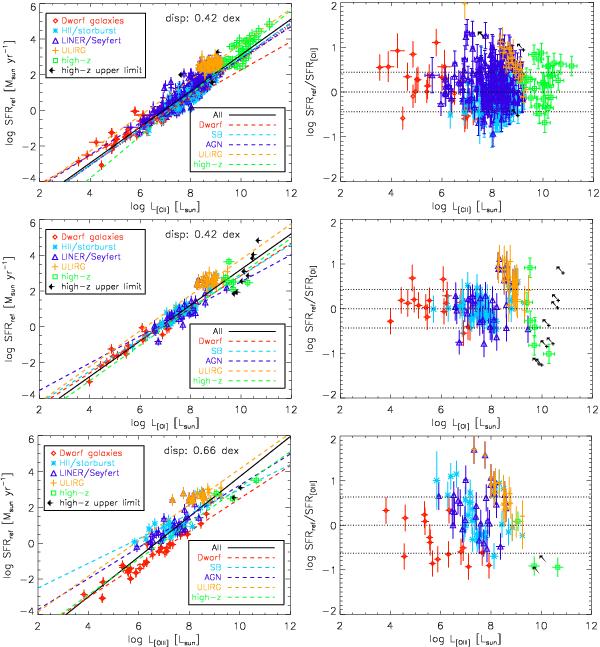
Left: SFR calibrations based on a literature sample of different galaxy populations for FIR fine-structure lines ([Cii] (top), [Oi]63 (middle), [Oiii]88 (bottom). DGS dwarf galaxies, Hii/starburst galaxies and composite, LINER or AGN sources are presented as red diamonds, blue asterisks, and purple triangles, respectively. ULIRGs with LFIR> 1012 L⊙ are indicated as orange crosses. High-redshift sources can be identified as green squares while upper limits for high-redshift objects are shown as black arrows. The solid black line shows the best-fit relation for the entire galaxy sample, while the dashed red, cyan, purple, orange, and green curves represent the SFR calibrations derived for separate galaxy populations, i.e., dwarf galaxies, starbursts, AGNs, ULIRGs, and high-redshift sources, respectively. The 1σ dispersion of the entire galaxy sample around the best fit is indicated in the bottom right corner of each panel. Right: dispersion plots indicating the logarithmic distance between the SFR estimates obtained from the reference SFR tracer and the FIR line emission. The 1σ dispersion of the entire literature sample is indicated as dashed black lines. The top panel also includes previous SFR calibrations reported in De Looze et al. (2011) (dotted red line) and Sargsyan et al. (2012) (dash-dotted blue line).
Current usage metrics show cumulative count of Article Views (full-text article views including HTML views, PDF and ePub downloads, according to the available data) and Abstracts Views on Vision4Press platform.
Data correspond to usage on the plateform after 2015. The current usage metrics is available 48-96 hours after online publication and is updated daily on week days.
Initial download of the metrics may take a while.