Fig. 5
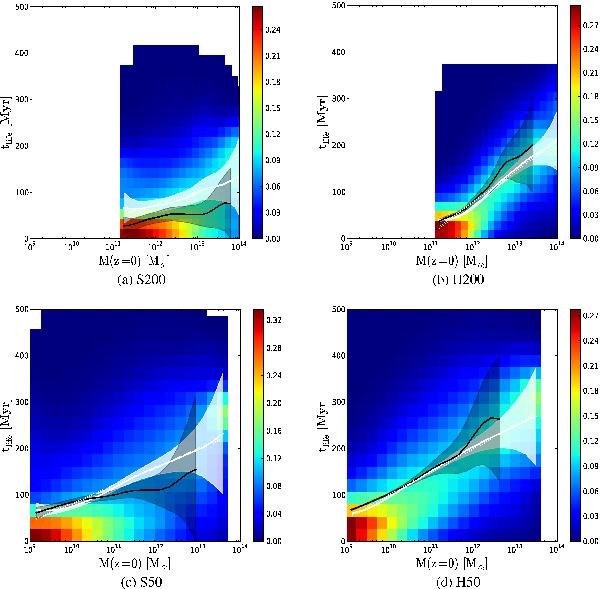
In the background we show the duration distribution of the initial HII region growth tlife for a halo of current M0 mass, extrapolated from the value when the HII region experienced a major merger. The color code is in arbitrary units with blue values indicating a faint probability, while the red tones denote a high probability. The white curve represents the mean value evolution of the whole distribution, the shaded area stands for the 3σ uncertainty on this value. The dotted white line represents the best fit of the mean value according to the fitting formula described in Appendix B. In black we plot the same average relation, extrapolating the halo mass from the moment the HII region appears.
Current usage metrics show cumulative count of Article Views (full-text article views including HTML views, PDF and ePub downloads, according to the available data) and Abstracts Views on Vision4Press platform.
Data correspond to usage on the plateform after 2015. The current usage metrics is available 48-96 hours after online publication and is updated daily on week days.
Initial download of the metrics may take a while.