Fig. 6
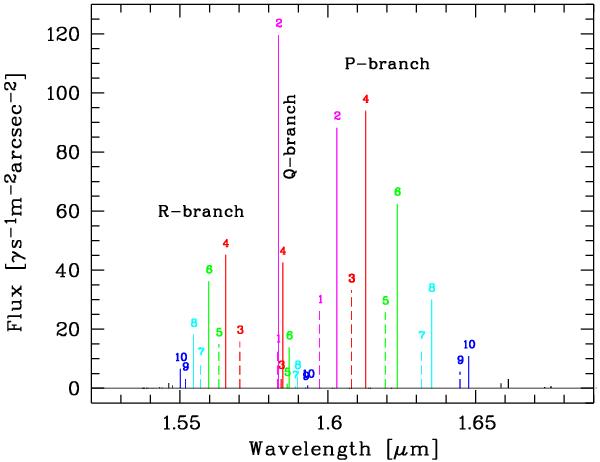
B-group identifications of the transitions of an OH band with the same rotational upper state (cf. Table 3). The tabulated wavelengths and zenithal mean fluxes of the lines of the OH(4–2) band are shown as example. Dashed and solid lines indicate transitions of the X2Π1/2 and X2Π3/2 state. The figure also indicates the R-, Q-, and P-branches that correspond to transitions with a change of the total angular momentum by −1, 0, and 1, respectively.
Current usage metrics show cumulative count of Article Views (full-text article views including HTML views, PDF and ePub downloads, according to the available data) and Abstracts Views on Vision4Press platform.
Data correspond to usage on the plateform after 2015. The current usage metrics is available 48-96 hours after online publication and is updated daily on week days.
Initial download of the metrics may take a while.