Fig. 13
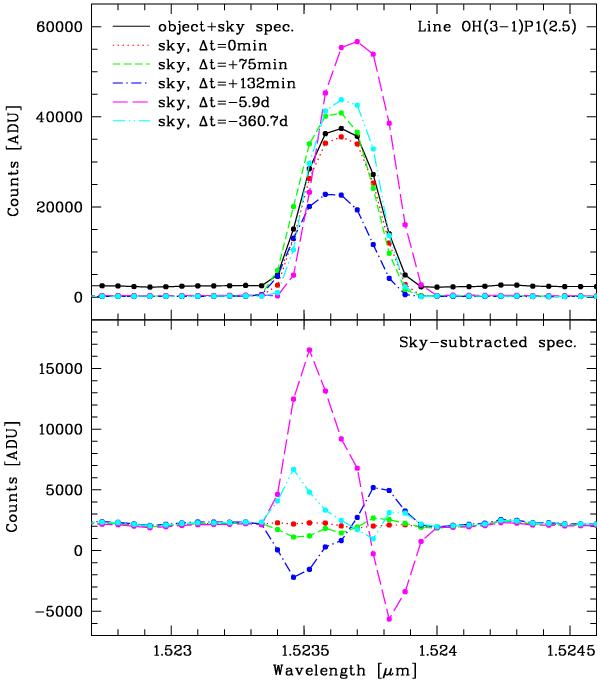
Subtraction of the strong airglow line OH(3–1)P1(2.5) for several time intervals between the object and the sky spectrum. The upper panel shows the line in the input object (black) and sky spectra (see legend for colour and line type). The lower panel displays the corresponding sky-subtraction residuals. To enhance their visibility, the ordinate was significantly zoomed.
Current usage metrics show cumulative count of Article Views (full-text article views including HTML views, PDF and ePub downloads, according to the available data) and Abstracts Views on Vision4Press platform.
Data correspond to usage on the plateform after 2015. The current usage metrics is available 48-96 hours after online publication and is updated daily on week days.
Initial download of the metrics may take a while.