Fig. 11
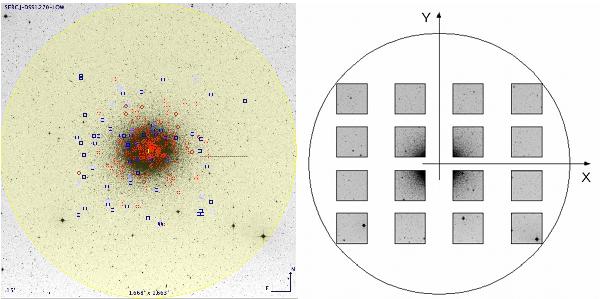
VISTA observations of ω Cen. Left panel: an example of variable star distribution across the sky field, where red circles mark the positions of known RR Lyrae stars, blue squares of known eclipsing binaries, and the yellow circle represents the VISTA FOV. Right panel: schematic map of VIRCAM’s 16 detectors, with ω Cen at the centre of the focal plane.
Current usage metrics show cumulative count of Article Views (full-text article views including HTML views, PDF and ePub downloads, according to the available data) and Abstracts Views on Vision4Press platform.
Data correspond to usage on the plateform after 2015. The current usage metrics is available 48-96 hours after online publication and is updated daily on week days.
Initial download of the metrics may take a while.