Fig. 7
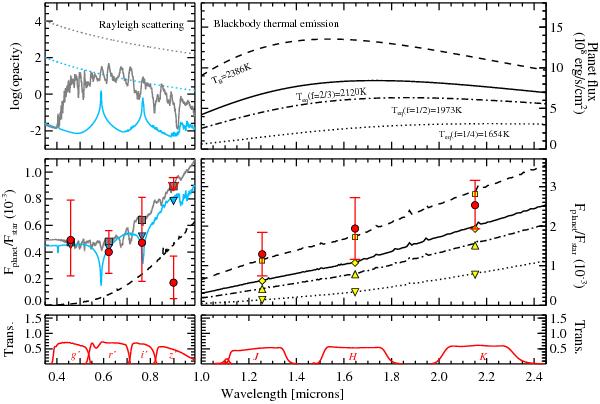
Dayside planet-to-star flux ratios of WASP-46b compared with theoretical models. The optical and NIR are divided into left and right panels for better display scale. The top panels show the assumed theoretical models. Rayleigh scattering and atomic/molecular absorption profiles are assumed for the reflected light, where a Na/K model (blue) and a TiO/VO model (gray) from Fortney et al. (2008, 2010) are adopted for the absorption profiles. Blackbody profiles are assumed for the thermal emission light. The middle panels show the corresponding planet-to-star flux ratios. Our data points are shown in red circles with error bars, while the values that are integrated in each bandpass are shown in yellow (blue or gray for the optical) shapes. The bottom panels show the transmission curve of each band.
Current usage metrics show cumulative count of Article Views (full-text article views including HTML views, PDF and ePub downloads, according to the available data) and Abstracts Views on Vision4Press platform.
Data correspond to usage on the plateform after 2015. The current usage metrics is available 48-96 hours after online publication and is updated daily on week days.
Initial download of the metrics may take a while.