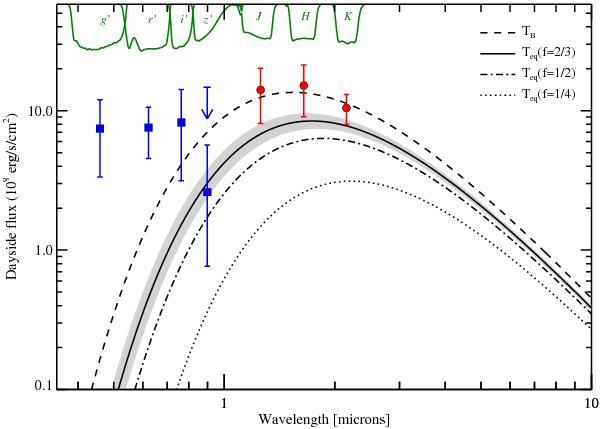
Fig. 6
Dayside flux measurements of WASP-46b compared with blackbody spectral energy distributions. Our measurements are shown as blue squares for the optical bands and as red circles for the NIR bands. The blue arrow shows the 3σ upper limit in the z′ band. Blackbody profiles of four temperatures are shown, including the JHK-weighted brightness temperature TB and three typical equilibrium temperatures (i.e., with f = 1/4,1/2,2/3, corresponding to planet-wide, dayside, no heat redistribution, respectively). The shaded area shows the uncertainties of the equilibrium temperature.
Current usage metrics show cumulative count of Article Views (full-text article views including HTML views, PDF and ePub downloads, according to the available data) and Abstracts Views on Vision4Press platform.
Data correspond to usage on the plateform after 2015. The current usage metrics is available 48-96 hours after online publication and is updated daily on week days.
Initial download of the metrics may take a while.