Free Access
Fig. 5
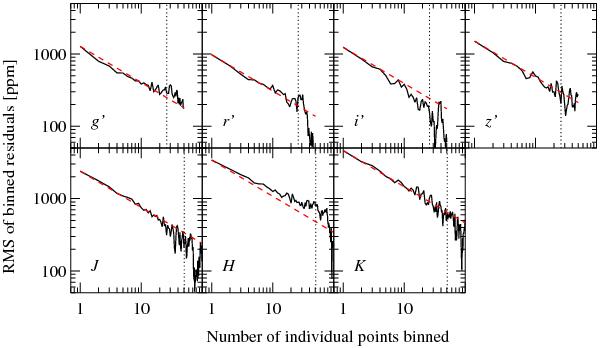
Standard deviation of the best-fit light-curve residuals binned in different time resolutions. The vertical dashed line refers to the ingress/egress duration. The dashed red line presents the expected Poisson-like noise. The deviation above the dashed red line indicates time-correlated red noise.
Current usage metrics show cumulative count of Article Views (full-text article views including HTML views, PDF and ePub downloads, according to the available data) and Abstracts Views on Vision4Press platform.
Data correspond to usage on the plateform after 2015. The current usage metrics is available 48-96 hours after online publication and is updated daily on week days.
Initial download of the metrics may take a while.