Fig. 1
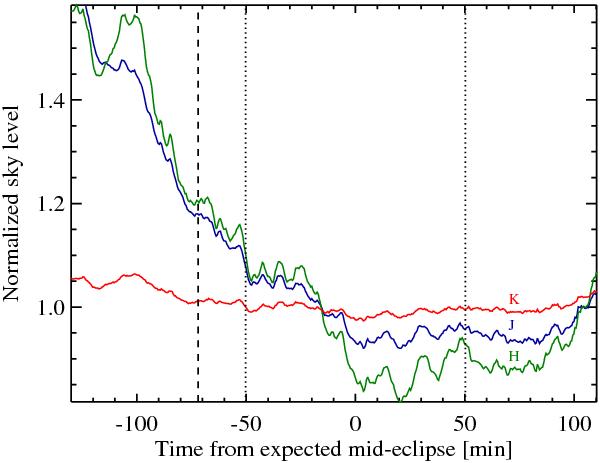
Normalized sky level versus elapsed time. Blue, green, and red curves show the sky levels of the J, H, and K bands. For each band, all the values are normalized by its median, so as to illustrate the overall variation. Data that were acquired before the time indicated by the vertical dashed line are not included in our final analysis. Two dotted lines indicate the expected first and last contacts of the secondary eclipse based on the assumption of a circular orbit.
Current usage metrics show cumulative count of Article Views (full-text article views including HTML views, PDF and ePub downloads, according to the available data) and Abstracts Views on Vision4Press platform.
Data correspond to usage on the plateform after 2015. The current usage metrics is available 48-96 hours after online publication and is updated daily on week days.
Initial download of the metrics may take a while.