Fig. 8
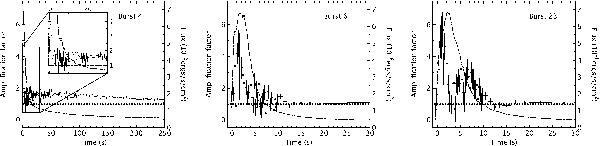
Amplification factor (fa) profiles (points with 1σ error bars) obtained from the spectral analysis of bursts 4 (left), 6 (middle), and 23 (right) of 4U 1636-536. For the longer burst 4, the first 30 s of the fa profile have been magnified for better comparison. The dashed lines correspond to the burst light curves, and the horizontal dotted lines to fa = 1.
Current usage metrics show cumulative count of Article Views (full-text article views including HTML views, PDF and ePub downloads, according to the available data) and Abstracts Views on Vision4Press platform.
Data correspond to usage on the plateform after 2015. The current usage metrics is available 48-96 hours after online publication and is updated daily on week days.
Initial download of the metrics may take a while.