Fig. 2
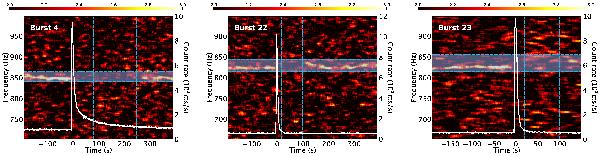
Dynamical PDS and light curves (white lines) around bursts 4 (left), 22 (middle), and 23 (right) of 4U 1636-536. The image corresponds to a series of 1 s PDS plotted as a function of time, convolved with a 6 Hz and 20 s averaging kernel for better visibility. Power is color-coded with a linear scale between 2 (black) and 3 (white). The blue zones and vertical dashed lines represent the time and frequency intervals used to probe the significance of the QPO nondetection in the simulations, namely 80−248 s and 840−865 Hz for burst 4, 20−100 s and 815−845 Hz for burst 22, and 20−100 s and 815−855 Hz for burst 23. We note that for burst 23 an observation interruption limits the analysis to ~150 s after the burst.
Current usage metrics show cumulative count of Article Views (full-text article views including HTML views, PDF and ePub downloads, according to the available data) and Abstracts Views on Vision4Press platform.
Data correspond to usage on the plateform after 2015. The current usage metrics is available 48-96 hours after online publication and is updated daily on week days.
Initial download of the metrics may take a while.