Fig. 1
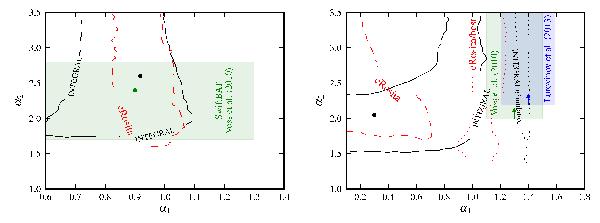
Simulation results for the LMXB (left) and the HMXB (right) populations. Black contours and points show a 68% probability that the simulated population will have the same flux distribution as observed in INTEGRAL 9-year Galactic survey and the best-fit results. The red countours show the forecast for the eRosita 4-year survey assuming the best-fit XLF found from INTEGRAL data. The black and red dotted contours represent results for the synthetic HMXB populations 1) by assuming the XLF parameters reported by Lutovinov et al. (2013) and observed with INTEGRAL and 2) by assuming the best-fit XLF parameters with α1 = 1.1 fixed at the highest value allowed and observed with eRosita, which is an optimistic forecast. The XLF parameters as reported by Voss & Ajello (2010) and Lutovinov et al. (2013) are also shown for reference.
Current usage metrics show cumulative count of Article Views (full-text article views including HTML views, PDF and ePub downloads, according to the available data) and Abstracts Views on Vision4Press platform.
Data correspond to usage on the plateform after 2015. The current usage metrics is available 48-96 hours after online publication and is updated daily on week days.
Initial download of the metrics may take a while.