Fig. 7
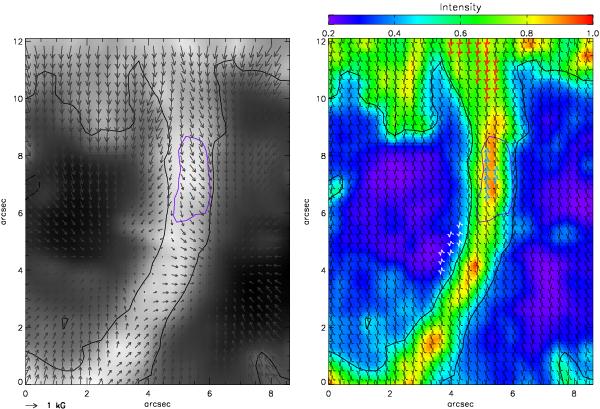
Chromospheric jets and the photospheric magnetic field. The left panel shows the horizontal magnetic field from an SP scan with black arrows for every pixel and has been overlaid on a Ca ii H filtergram taken 6 min after the SP slit was above the light bridge. The right panel shows the photospheric continuum intensity map in the background with the Stokes V profiles overlaid on each pixel of the map. Only the 6302.5 Å line has been shown and has been clipped to ±8% of the quiet Sun continuum intensity. The purple contour outlines the region of strong NCP indicated in Fig. 6. See text for the description of the blue, red, and white profiles. The black contour outlines the light bridge and was derived from the continuum intensity image at 630 nm in the SP scan.
Current usage metrics show cumulative count of Article Views (full-text article views including HTML views, PDF and ePub downloads, according to the available data) and Abstracts Views on Vision4Press platform.
Data correspond to usage on the plateform after 2015. The current usage metrics is available 48-96 hours after online publication and is updated daily on week days.
Initial download of the metrics may take a while.