Fig. 6
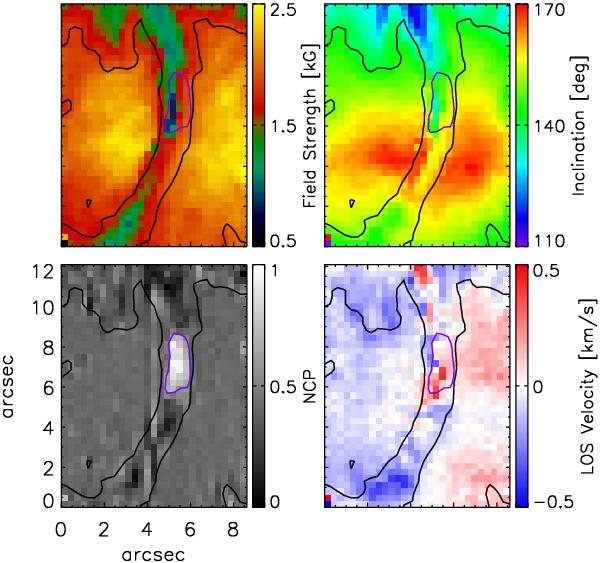
Physical parameters in the light bridge. Clockwise from top left: magnetic field strength, field inclination, LOS velocity, net circular polarization. All maps have been scaled according to their colour bars. The maps correspond to the SP scan from 10:05−10:21 UT. The purple contour in the panels outlines a region of large NCP. The black contour outlines the light bridge and was derived from the continuum intensity image at 630 nm in the SP scan.
Current usage metrics show cumulative count of Article Views (full-text article views including HTML views, PDF and ePub downloads, according to the available data) and Abstracts Views on Vision4Press platform.
Data correspond to usage on the plateform after 2015. The current usage metrics is available 48-96 hours after online publication and is updated daily on week days.
Initial download of the metrics may take a while.