Fig. 3
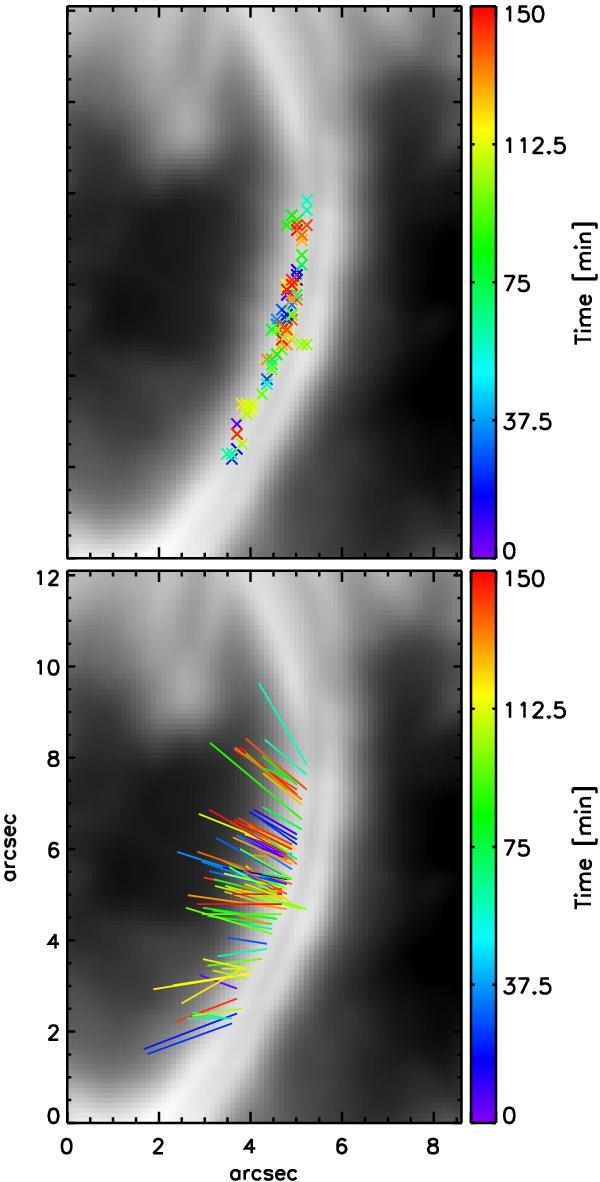
Representation of the properties of the chromospheric jets detected over the observing period. The top panel shows the location of the base of the jet while the bottom panel indicates the length and orientation of the jet. The colours represent the time in the sequence when the jet was identified. The crosses and lines have been overlaid on the time-averaged Ca ii H image.
Current usage metrics show cumulative count of Article Views (full-text article views including HTML views, PDF and ePub downloads, according to the available data) and Abstracts Views on Vision4Press platform.
Data correspond to usage on the plateform after 2015. The current usage metrics is available 48-96 hours after online publication and is updated daily on week days.
Initial download of the metrics may take a while.