Fig. 1
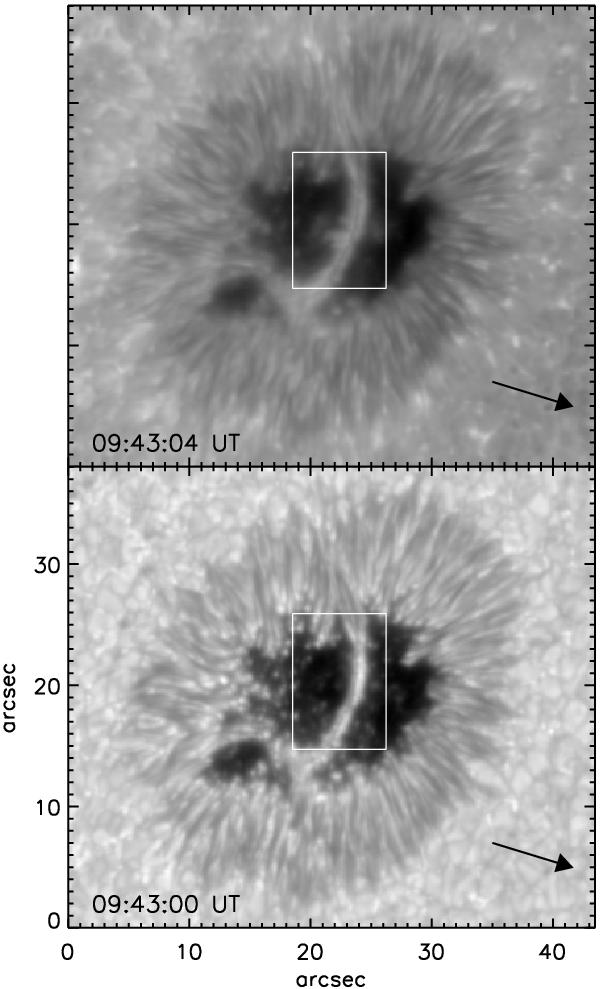
Leading sunspot in NOAA AR 11271. The top and bottom panels correspond to the Ca ii H and G band, respectively. The large white rectangle represents the FOV selected for the analysis and shown in subsequent figures. The arrow points to disk centre. The images are displayed on a logarithmic scale.
Current usage metrics show cumulative count of Article Views (full-text article views including HTML views, PDF and ePub downloads, according to the available data) and Abstracts Views on Vision4Press platform.
Data correspond to usage on the plateform after 2015. The current usage metrics is available 48-96 hours after online publication and is updated daily on week days.
Initial download of the metrics may take a while.