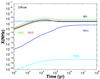
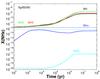
Fig. C.2
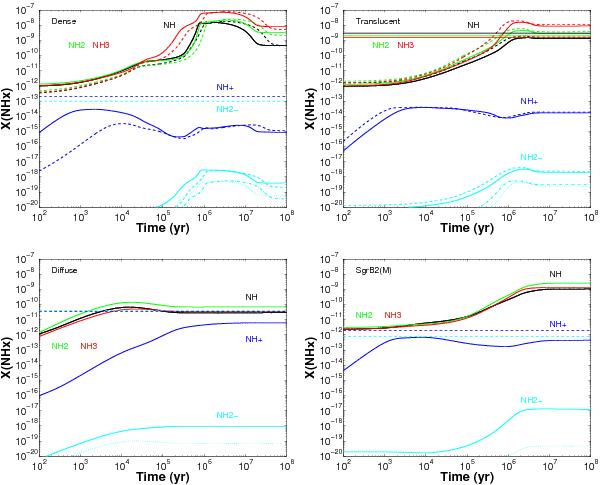
Temporal evolution of the nitrogen hydride abundances. Upper
left: dense gas; upper right: translucent gas;
lower left: diffuse gas; lower right:
Sgr B2 (M) envelope model (see Table 3).
The dot-dashed and dotted lines for NH represent the estimated X(NH
 for the TK
= 30 K and 50 K (translucent) and TK = 30
K and 10 K (dense) models. The observed abundances and upper limits corresponding
to the different models are indicated with solid and dashed horizontal lines,
respectively, following the respective species colour code.
for the TK
= 30 K and 50 K (translucent) and TK = 30
K and 10 K (dense) models. The observed abundances and upper limits corresponding
to the different models are indicated with solid and dashed horizontal lines,
respectively, following the respective species colour code.
Current usage metrics show cumulative count of Article Views (full-text article views including HTML views, PDF and ePub downloads, according to the available data) and Abstracts Views on Vision4Press platform.
Data correspond to usage on the plateform after 2015. The current usage metrics is available 48-96 hours after online publication and is updated daily on week days.
Initial download of the metrics may take a while.