Fig. 4
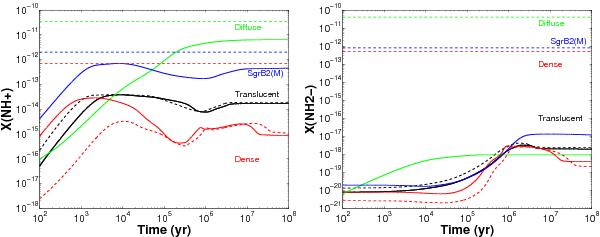
Temporal evolution of the NH+ (left) and
NH (right) abundances using gas and surface chemistry and a typical
active non-thermal desorption efficiency aRRK = 0.01 using four different
sets of conditions (see Table 3). Typical
diffuse cloud conditions in green, translucent cloud conditions in black, dense cloud
conditions in red, and a special model for the Sgr B2 (M) molecular envelope in blue.
The solid and dashed lines represent TK = 30 K and 50 K (translucent
model) and TK =
30 K and 10 K (dense model), respectively. The observed upper
limits from both species (Table 2) in dense gas
(from W31C), diffuse gas (similar limits for both sight-lines), and in the Sgr B2 (M)
molecular envelope are indicated by dashed horizontal lines following the respective
colour code.
(right) abundances using gas and surface chemistry and a typical
active non-thermal desorption efficiency aRRK = 0.01 using four different
sets of conditions (see Table 3). Typical
diffuse cloud conditions in green, translucent cloud conditions in black, dense cloud
conditions in red, and a special model for the Sgr B2 (M) molecular envelope in blue.
The solid and dashed lines represent TK = 30 K and 50 K (translucent
model) and TK =
30 K and 10 K (dense model), respectively. The observed upper
limits from both species (Table 2) in dense gas
(from W31C), diffuse gas (similar limits for both sight-lines), and in the Sgr B2 (M)
molecular envelope are indicated by dashed horizontal lines following the respective
colour code.
Current usage metrics show cumulative count of Article Views (full-text article views including HTML views, PDF and ePub downloads, according to the available data) and Abstracts Views on Vision4Press platform.
Data correspond to usage on the plateform after 2015. The current usage metrics is available 48-96 hours after online publication and is updated daily on week days.
Initial download of the metrics may take a while.