Free Access
Fig. C.4
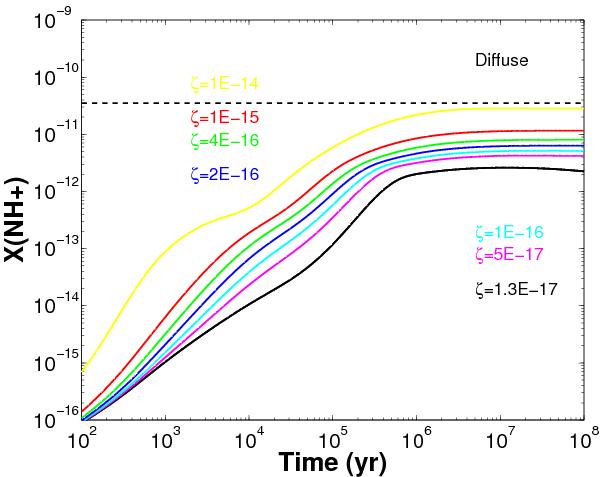
Temporal evolution of the NH+ abundance for different cosmic ray ionisation rates for diffuse gas conditions (Table 3). The dashed black line represents the observed upper NH+ limit in the diffuse gas.
Current usage metrics show cumulative count of Article Views (full-text article views including HTML views, PDF and ePub downloads, according to the available data) and Abstracts Views on Vision4Press platform.
Data correspond to usage on the plateform after 2015. The current usage metrics is available 48-96 hours after online publication and is updated daily on week days.
Initial download of the metrics may take a while.