Fig. 1
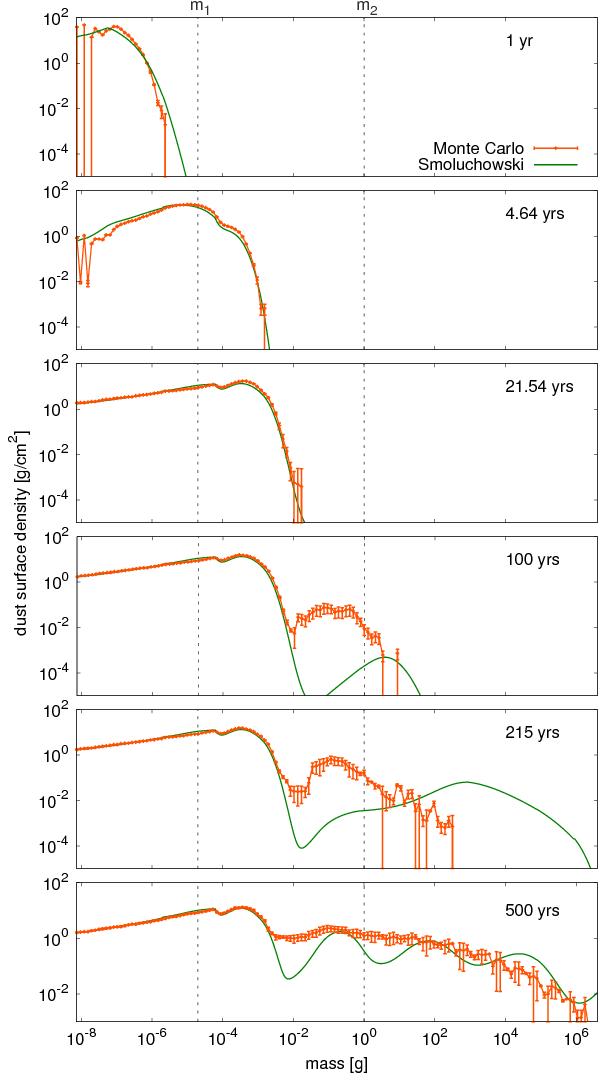
Comparison of the mass distribution evolution obtained using our Smoluchowski and Monte Carlo codes. In a standard case when an insurmountable fragmentation barrier is present, the two methods perfectly agree (three upper panels); however, we encounter some differences between the results obtained with the two approaches (three bottom panels) with the possibility of breakthrough. For the Smoluchowski code, the presented results were obtained with a resolution of 30 mass bins per decade. For the Monte Carlo code, the results are averaged from the simulations using 120 000 particles. The “check points”, m1 and m2, which are indicated with the dotted lines, are used to quantitatively compare dust growth timescales in Sect. 4.1.
Current usage metrics show cumulative count of Article Views (full-text article views including HTML views, PDF and ePub downloads, according to the available data) and Abstracts Views on Vision4Press platform.
Data correspond to usage on the plateform after 2015. The current usage metrics is available 48-96 hours after online publication and is updated daily on week days.
Initial download of the metrics may take a while.