Fig. 2
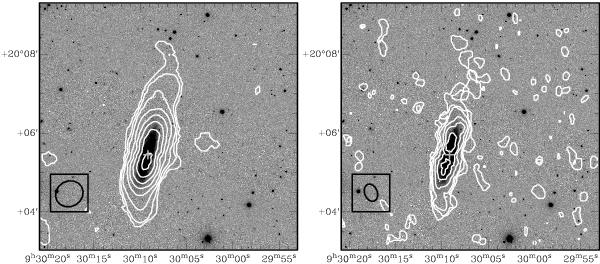
Integrated H i emission contours (white) overplotted on a SDSS r-band images. Left: integrated emission contours from the low resolution H i map, (beam size = 45.57′′× 41.35′′) where the H i column density levels are 1020 atoms cm-2× (0.5, 1.2, 2.3, 4.7, 7.0, 9.3, 11.6, 14.0). Right: integrated emission contours from the high resolution H i map, (beam size = 26.08′′× 19.97′′) where the H i column density levels are 1020 atoms cm-2× (1.6, 3.2, 6.3, 10.6, 19.0, 25.3). The first contours are at the 3σ level. At the bottom left of each panel a black ellipse shows the beam size. The optical centre of the galaxy is marked with a grey cross.
Current usage metrics show cumulative count of Article Views (full-text article views including HTML views, PDF and ePub downloads, according to the available data) and Abstracts Views on Vision4Press platform.
Data correspond to usage on the plateform after 2015. The current usage metrics is available 48-96 hours after online publication and is updated daily on week days.
Initial download of the metrics may take a while.