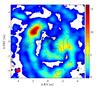
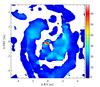
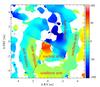
Fig. 4

ALMA cycle 0 molecular 12CO(3−2) maps. a) Emission map of 12CO(3−2) [Jy beam-1 km s-1] overlaid with H2(1−0)S(1) emission contours. The red ellipse at −4,4 describes the beam size. The dispersion (moment 2) is shown in b) and the LOSV is shown in c), both maps are in [km s-1]. c) Cuts for the position velocity (PV) diagrams (see Fig. 12). The cuts were not set on the galactic center but along the central velocity gradient of the 12CO(3−2) 1st moment map.
Current usage metrics show cumulative count of Article Views (full-text article views including HTML views, PDF and ePub downloads, according to the available data) and Abstracts Views on Vision4Press platform.
Data correspond to usage on the plateform after 2015. The current usage metrics is available 48-96 hours after online publication and is updated daily on week days.
Initial download of the metrics may take a while.