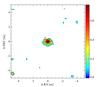
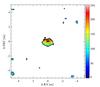
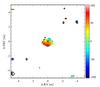
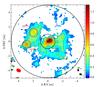
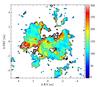
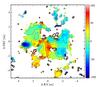
Fig. 3
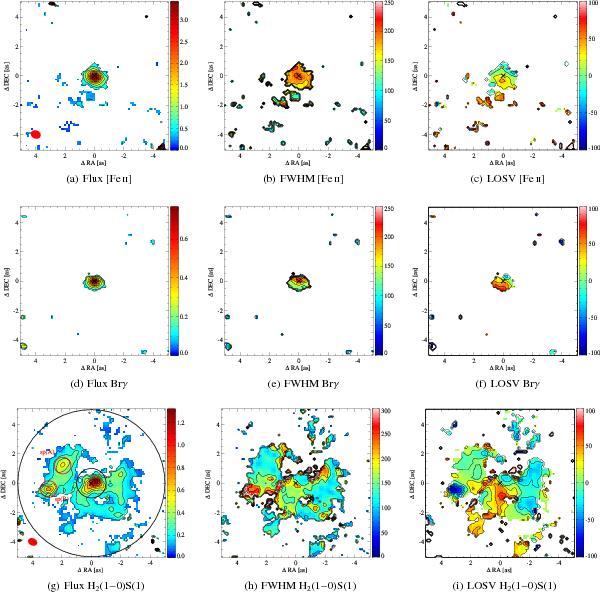
Flux [10-20 W m-2], FWHM [km s-1], and LOSV [km s-1] maps (left to right) of the [Fe ii], Brγ, and H2λ(1−0)S(1) lines (top to bottom). a) and g) show the beam size in the lower left corner for H- and K-band respectively. g) Shows the aperture sizes taken for our measurements. One angular resolution element (beam) corresponds to a PSFFWHM of 0 62 in H-band and 056 in K-band (see Fig. 2). The centered circles are of radius 1″ and 5″ respectively. The red circles marking the emission regions sp(A) and sp(B) are of radius 0.̋56. The black cross marks the position of the adopted center.
Current usage metrics show cumulative count of Article Views (full-text article views including HTML views, PDF and ePub downloads, according to the available data) and Abstracts Views on Vision4Press platform.
Data correspond to usage on the plateform after 2015. The current usage metrics is available 48-96 hours after online publication and is updated daily on week days.
Initial download of the metrics may take a while.