Fig. 19
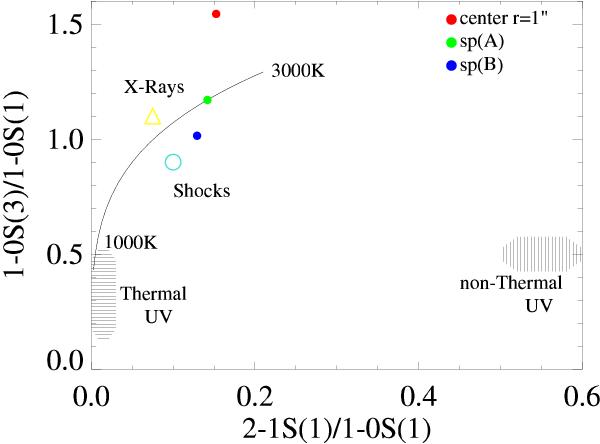
Molecular hydrogen diagnostic diagram to classify the emission at the nucleus in red and in emission spots sp(A) in green and sp(B) in blue. Line ratios are H2(2−1)S(1)/H2(1−0)S(1) and H2(1−0)S(3)/H2(1−0)S(1). The curve represents thermal emission at 1000–3000 K. Horizontal stripes are thermal UV excitation models by Sternberg & Dalgarno (1989). Vertical stripes are non-thermal models by Black & van Dishoeck (1987). The area of X-ray heating models by Draine & Woods (1990) is marked by an open triangle (yellow). The open turquoise circle marks the region of the shock model by Brand et al. (1989).
Current usage metrics show cumulative count of Article Views (full-text article views including HTML views, PDF and ePub downloads, according to the available data) and Abstracts Views on Vision4Press platform.
Data correspond to usage on the plateform after 2015. The current usage metrics is available 48-96 hours after online publication and is updated daily on week days.
Initial download of the metrics may take a while.